



Multiple Factors Point To An Elevated Risk Of Foreclosures In Rockland County, According to NestCash
NestCash, a real estate investment and data company published a county-level New York Foreclosure Risk Index, and scored against the 55 counties outside New York City, Rockland ranks first.
The first-place ranking is not a good thing.
One driver behind the ranking is housing cost burden: 44.0 percent of Rockland’s mortgaged owners spend more than 30 percent of income on housing, the highest of any county outside the city.
On the full statewide ranking, Rockland is fourth out of sixty counties, behind only the Bronx, Queens, and Brooklyn. Neighboring Orange ranks right behind Rockland in fifth place, statewide.
NestCash devised a Foreclosure Risk Index and scored each county based on a number of factors, including a 90-day delinquency rate as calculated by the federal Consumer Financial Protection Bureau, the American Community Survey 5-year data survey on unemployment rates (via Census Bureau data), listing price cuts, days on market (Realtor.com Economic Research), and mortgage cost burden.
Statewide, Rockland County came in fourth and had an “elevated” risk of foreclosure. For the counties outside New York City, Rockland had the highest score and the greatest risk of foreclosure compared to other counties outside the city.
Statewide, Orange County came in fifth, also with an elevated risk. Putnam came in eighth with a moderate foreclosure risk. Westchester fell in at number 26 of the 55 counties outside the city. Westchester (26), Ulster (17), and Dutchess (12) were all considered lower risk counties for foreclosures.
Sullivan County came in at number seven (moderate risk), but because it has a large second home market, some of the factors were skewed.
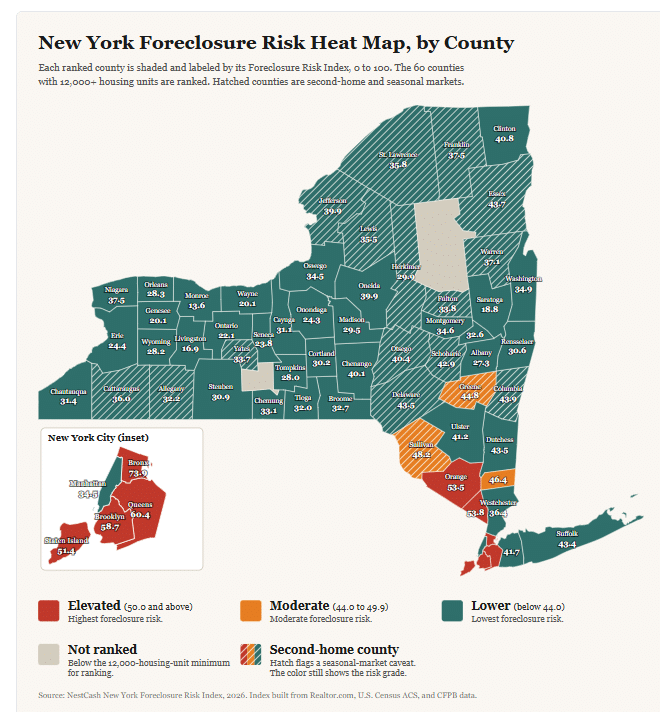
The scoring for each county was from 0 to 100 by blending four public signals, each weighted by how directly it bears on a mortgaged homeowner: market softness (35 percent), mortgage cost burden (30 percent), 90-day mortgage delinquency (20 percent), and unemployment (15 percent). A county grades “Elevated” at 50 or above, “Moderate” from 44 to 49.9, and “Low” below 44. The ranking only included the 60 New York counties with at least 12,000 housing units.
Rockland scored 53.8; Orange 53.5; Putnam 46.4; and Westchester 36.4.
Market softness was evaluated as the share of active listings with a price cut and the median number of days a home sits on the market. A soft market matters because a homeowner in trouble who cannot sell quickly has fewer ways to avoid foreclosure.
Mortgage cost burden considered the share of owners with a mortgage who spend more than 30 percent of household income on housing. This is a direct payment stress on the exact population that can be foreclosed on.
Mortgage delinquency viewed the 90-day-or-more delinquency rate, the clearest early warning that foreclosures are coming.
Countywide Unemployment rates were considered a secondary driver because unemployment rates also capture renters.
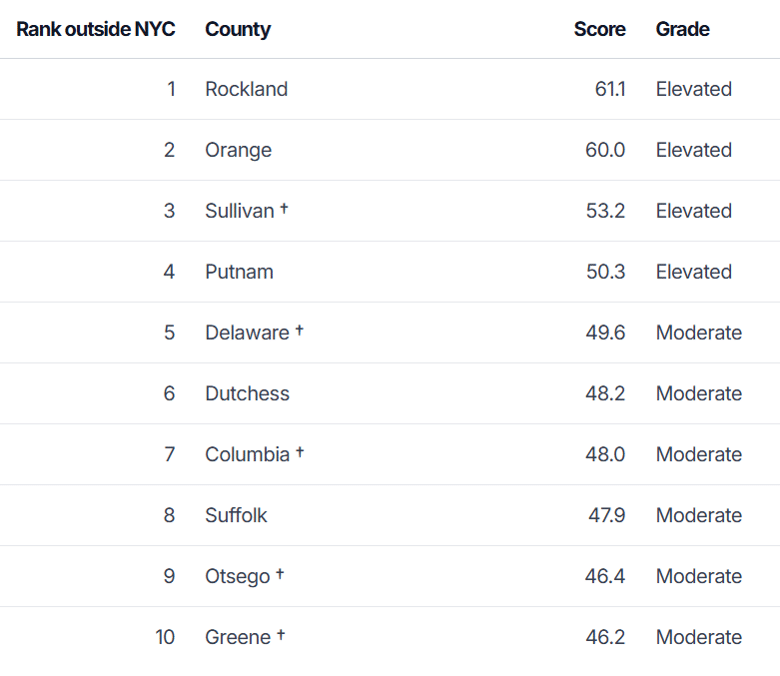
When measuring county scores outside New York City, Rockland came in at number one, followed by Orange, Sullivan and Putnam.
Other data presented in the report detailed the average number of days foreclosures of residential properties took in New York Courts from 2011 to 2026 (to date).
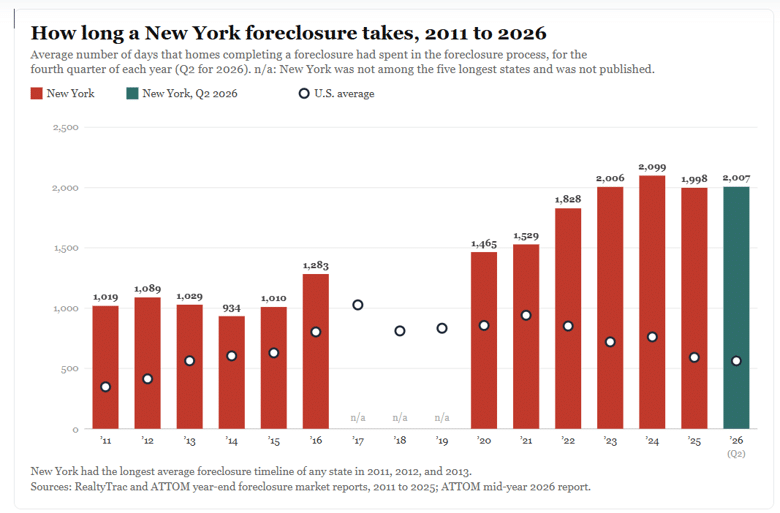
The data reflects those foreclosures that went through the full process in court, all the way to sale, and not those that resolved through settlement or negotiated refinancing.
The New York State Attorney General’s Homeowner Protection Program funds a statewide network of nonprofit legal services and housing counseling organizations that help homeowners at no cost, including representation at settlement conferences. You can reach it at 1-855-466-3456 or through homeownerhelpny.com. You can also find a HUD-approved counselor through the CFPB’s housing counselor search.
Graphs and data courtesy of NestCash. Reproduced with permission.