











New York Metro Area Inflation Rate Exceeds National Average, Again
ANALYSIS
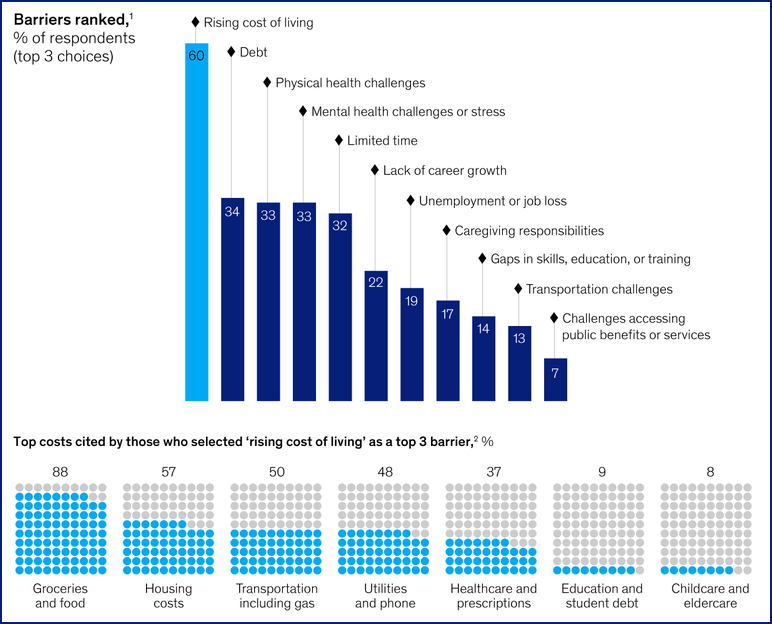
The defining challenge for Americans remains the rising cost of living. The pressure on household budgets is cited the most frequently, outpacing other challenges including health issues and debt. According to the McKinsey Institute for Economic Mobility, the greatest strain on household budgets comes from essential expenses, with nearly nine out of ten citing the cost of groceries and food. Housing, transportation, and utilities are also major sources of financial pressure.
July saw some relief from the growth of inflation, though the easing of prices in essential commodities was negligible.
Here in New York, the metropolitan area experienced a headline consumer price inflation rate of 4.6% over the preceding 12 months, while core inflation (excluding food and energy) rose 4.0%. This local rate remained notably higher than the broader U.S. annual inflation rate of 3.4%, representing a negligible cooling off from the 3.5% annual rate in June.
Consumer Sentiment
As of August 2026, the University of Michigan Surveys of Consumer Sentiment (an important measure of consumer perceptions) places the preliminary Index of Consumer Expectations at 50.6 points (down from 55.4 in July), reflecting an 8.7% drop from July.
Short- and long-term business expectations have declined amid persistent cost-of-living strains, with only 8% of consumers expecting their income growth to outpace inflation. And year-ahead inflation expectations ticked up to 4.3%, influenced by elevated energy costs, though long-run expectations held steady at 3.3%
The Michigan Consumer Sentiment Index (MCSI) is a monthly survey of consumer confidence levels in the United States conducted by the University of Michigan. Consumer sentiment is a statistical measurement of the overall health of the economy as determined by consumer opinion. It takes into account people’s feelings toward their current financial health, the health of the economy in the short term, and the prospects for longer-term economic growth, and is widely considered to be a useful economic indicator.
Fuel Prices
Gasoline prices remain stubbornly high with the national average price for unleaded regular gasoline at $4.07 per gallon, with the average in New York State and Rockland County at $4.1332 and $4.264, respectively. Rockland County gasoline prices are regularly reported above the state and national averages.
The national average price for retail diesel fuel in the United States is approximately $5.44 per gallon according to AAA Fuel Prices, while the U.S. Energy Information Administration (EIA) tracks the weekly average closer to $5.26 per gallon. Prices are noticeably higher in New York, averaging around $5.61 per gallon.
Food Prices
U.S. food prices rose a minimal 0.1% overall in July according to the Bureau of Labor Statistics CPI Report, held down by a 0.1% dip in grocery costs (food at home). While overall food prices are up 3% from a year ago, July brought relief via cheaper meat and plunging lettuce prices. Lettuce prices fell over 16% following a food safety recall and subsequent retailer discounts.
The average retail price for a pound of 100% ground roast coffee in the U.S. was $9.32 ($9.317) in July 2026, according to the U.S. Bureau of Labor Statistics. This represents a 10.7% increase from July 2025 ($8.41), though it is a slight decrease from the all-time peak of $9.72 reached in April 2026
The U.S. unemployment rate was 4.1% in July 2026, dropping slightly from 4.2% the previous month according to figures from the U.S. Bureau of Labor Statistics.

Editor’s Note: For many months, when the government ceased publishing data, RCBJ has paused its “Price Tracker” — a tool enabling readers to see the effects on prices for various commodities from January 2024 through July 2026. Now with data available again, we are back online. Just one caveat: data was blacked out during the government shutdown in October, 2025. There have also been a few holes in the data, and where those holes appear, rather than extrapolate the data, we simply left the month blank. The blanks appear as a gap in the graphs below.
The categories we are tracking are:
- Whole Milk
- Grade A Large Eggs
- Navel Oranges
- Tomatoes, Field Grown
- Ground Chuck, 100% Beef
- Chicken, Fresh, Whole
- Electricity Per KWH
- Gasoline, Regular Unleaded
- Unemployment Rate
- 30-Year Fixed Mortgage Rate (Average)
- Coffee, 100% Ground Roast



Scroll down to view the data.